Tips & Tricks
Tips & tricks For Microsoft Excel, Power BI, SQL and more
Read a selection of tips & tricks that make using Microsoft Excel, Power BI, SQL and more way easier!
We’ve got loads of handy user guides for Microsoft Excel, Power BI, SQL, SharePoint and more that’ll make your life way easier. Want to learn how to get the best out of your Microsoft 365 and Microsoft Power Platform applications in your organisation? Contact us today about training courses for business.
 Tips & Tricks
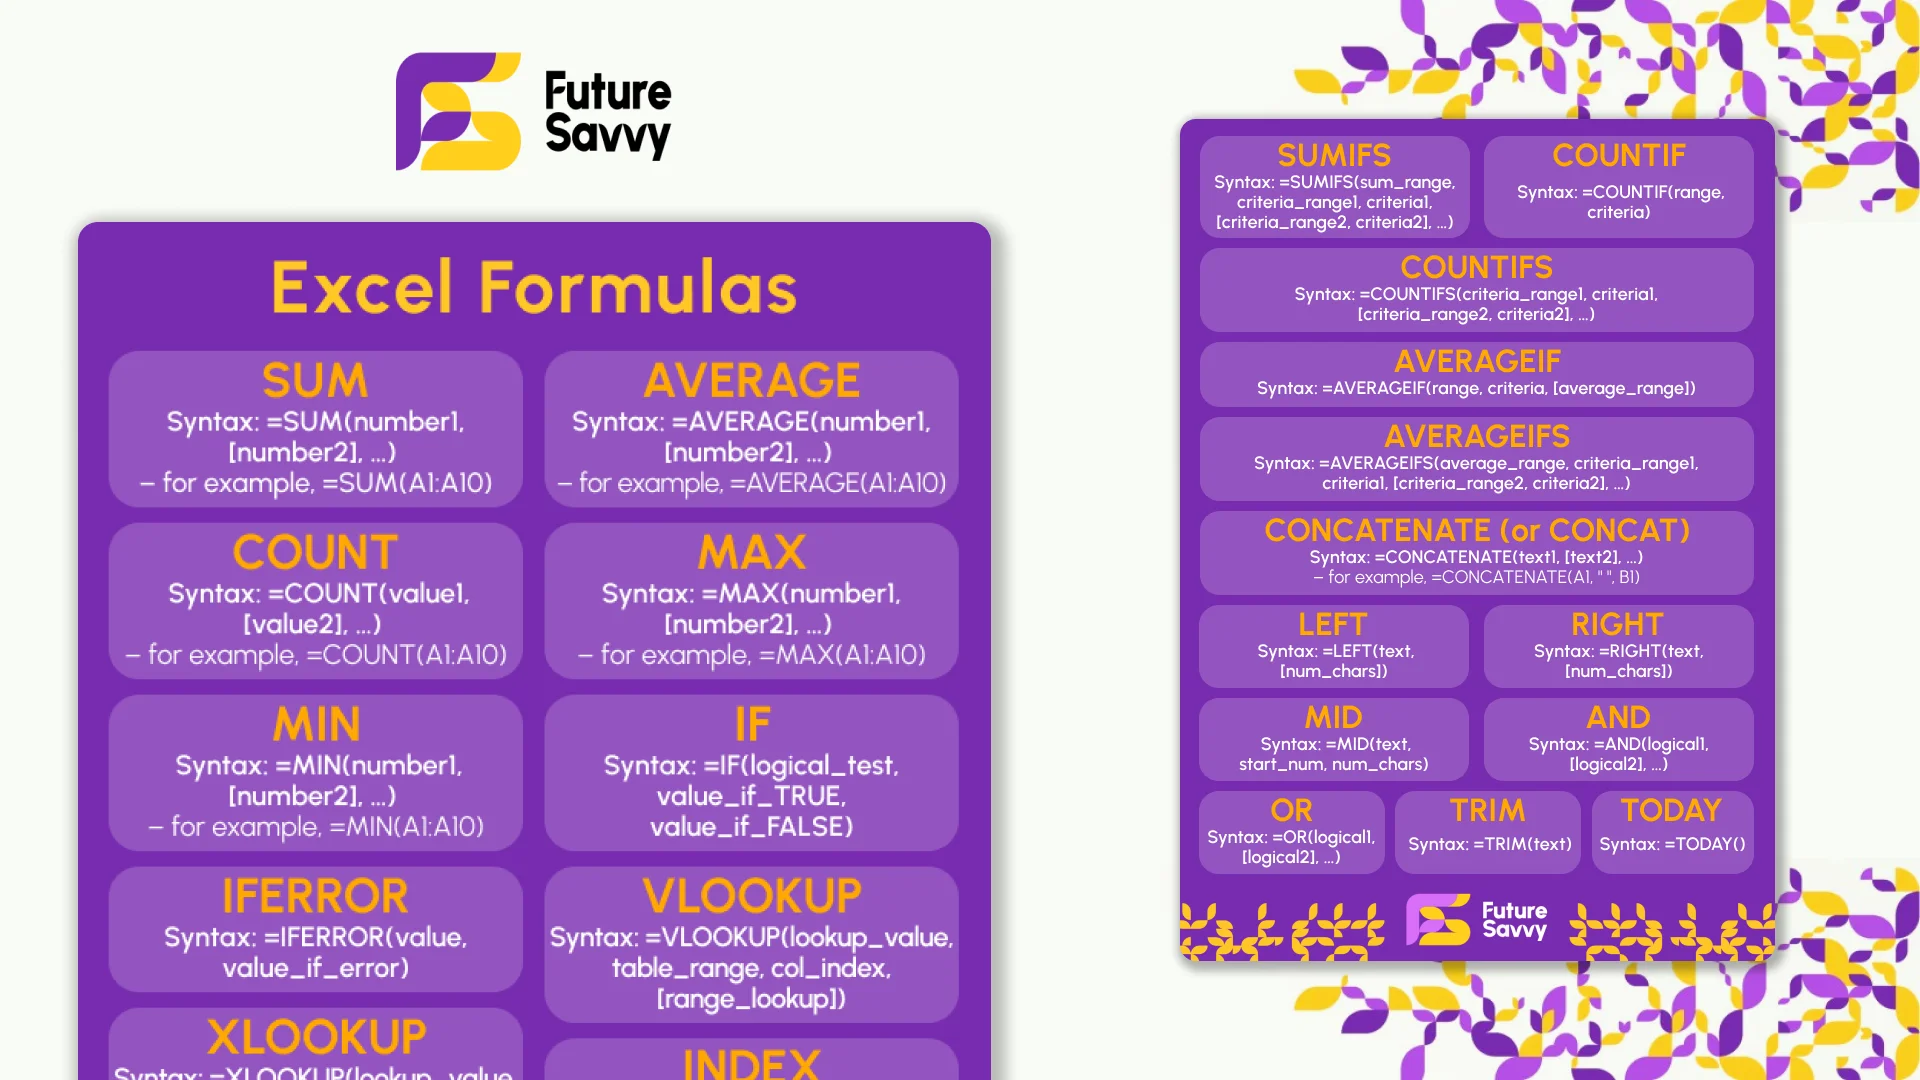
Excel Formulas Cheat Sheet: 34 Formulas With Examples
Thirty-four Excel formulas with the syntax, a worked example and the mistake people make with each: SUM to SUBTOTAL, IF and IFS, XLOOKUP and INDEX-MATCH, SUMIFS and COUNTIFS, the text and date functions, and the dynamic array functions in Excel 365. Read it on the page, copy any formula, or download the two-page printable PDF. No sign-up.
 Tips & Tricks
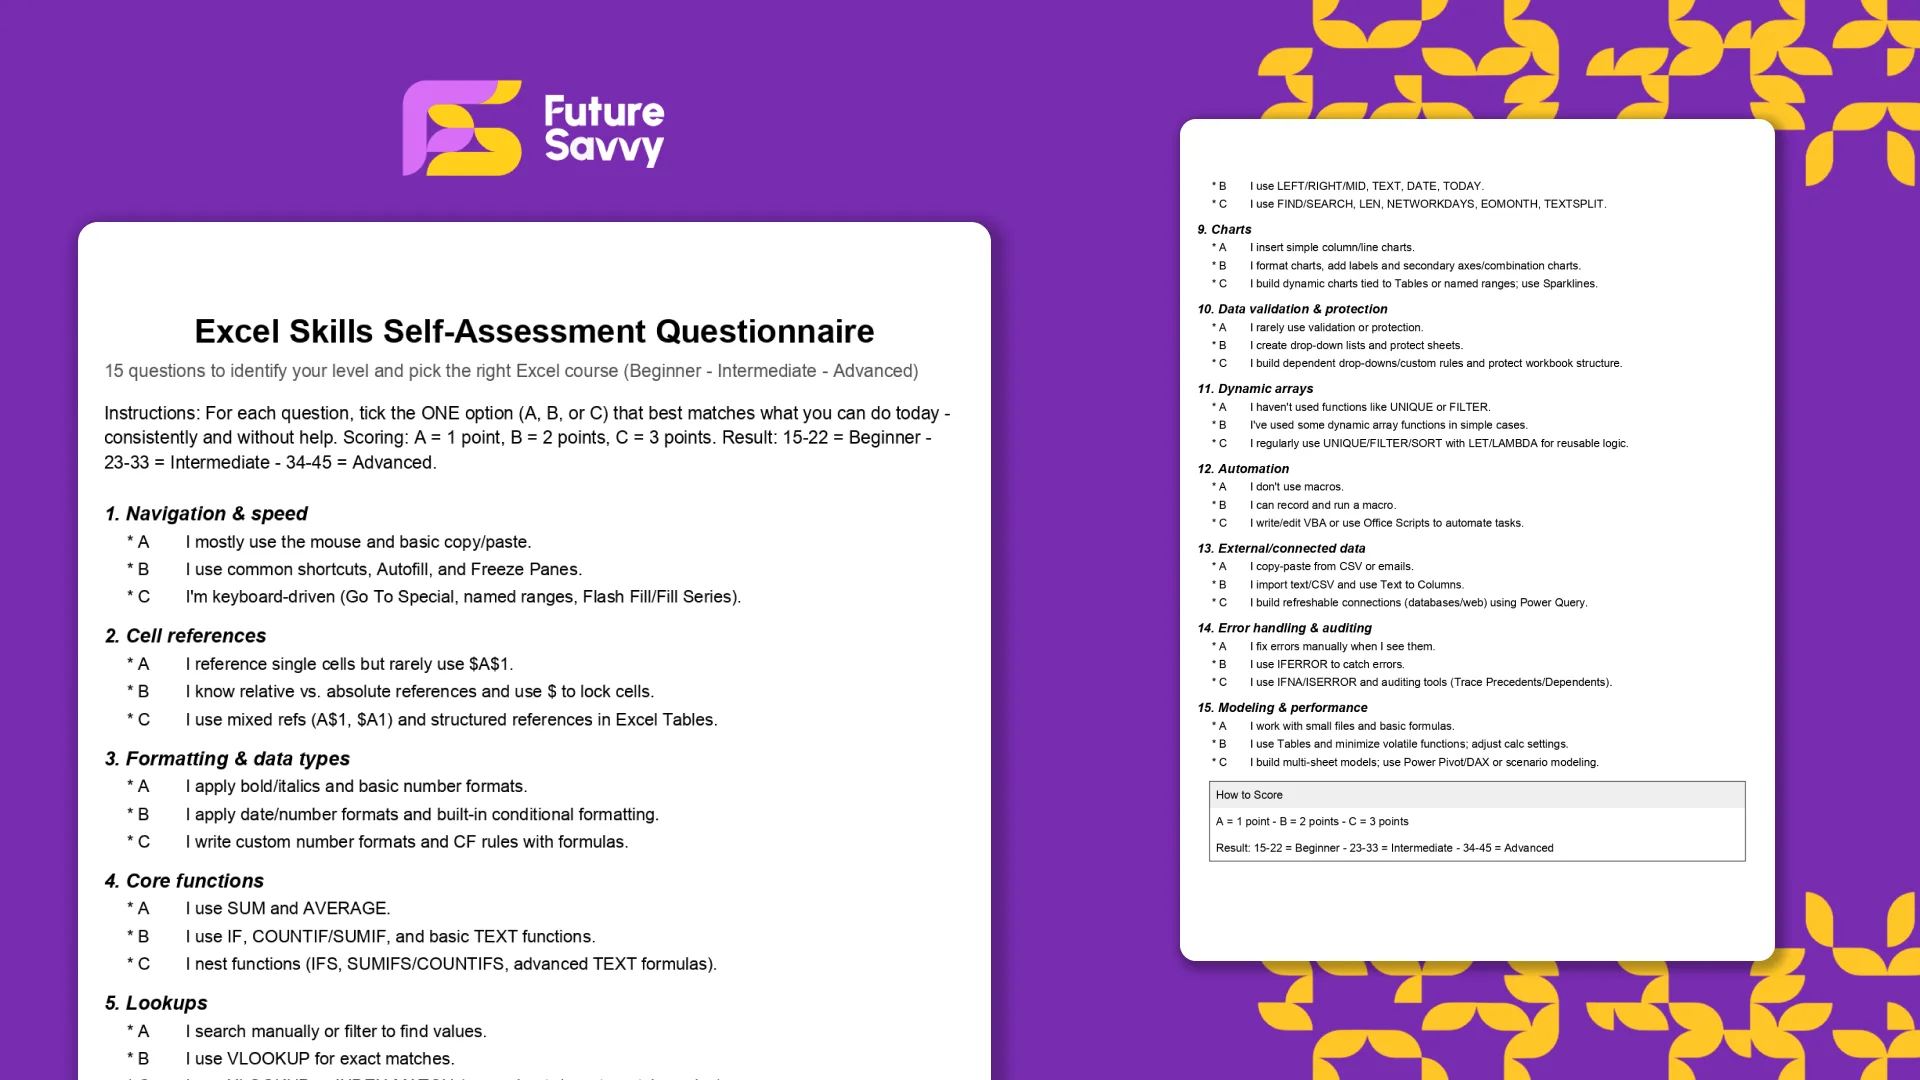
Excel Skills Self-Assessment Questionnaire
This free, printable Excel Skills Self-Assessment helps you quickly gauge your level and pick the right next step in your learning path. It contains 15 multiple-choice questions spanning navigation, formulas, lookups, tables, PivotTables, charts, dynamic arrays, Power Query, and more. You’ll score yourself and interpret the result to see whether you’re Beginner, Intermediate, or Advanced - then follow tailored course recommendations based on your score.
 Tips & Tricks
How to Calculate Age in Excel: DATEDIF Formula and Examples
Use a copy-and-paste DATEDIF formula to calculate age from a date of birth in Excel. This guide also covers fixed reporting dates, YEARFRAC and the input checks that prevent bad results.
 Tips & Tricks
How to Calculate Variance in Excel (VAR.S vs VAR.P)
In this guide, we explain variance as a measure of how widely data points deviate from the mean and shows why understanding this spread is useful for deeper insight and risk assessment. It walks readers through calculating variance in Excel, distinguishing between the VAR.S function for a sample and VAR.P for an entire population, then demonstrates each with a car-sales case study.
 Tips & Tricks
How to Use Excel Lookup with Multiple Criteria
This blog explains how Excel’s LOOKUP functions—particularly XLOOKUP and VLOOKUP—can retrieve data based on multiple criteria. It walks through a step-by-step example of finding an employee’s sales in a specific region, showing both an XLOOKUP formula and a VLOOKUP alternative that uses a helper column.
 Tips & Tricks
Microsoft 365 Copilot deployment: a practical UK team-adoption plan
Microsoft 365 Copilot can super-charge Word, Excel, Outlook, PowerPoint, and Teams, but IT managers must align licensing, data governance, and clear business goals before launch. In this article, we discuss how engaging stakeholders early, piloting with a small cross-functional group, and phasing the rollout lets teams refine guidance and measure real productivity gains. Role-specific, hands-on training - prompt-engineering tips, quick-start resources, and “Copilot champions” - converts into confident daily use while resolving emerging user challenges.
 Tips & Tricks
Microsoft Copilot ROI for UK businesses: how to build the case
The blog explains how to evaluate Microsoft 365 Copilot (and Copilot Pro) using a clear ROI formula and data from Forrester’s Oct-2024 TEI study. It outlines three benefit areas - go-to-market (potential revenue lift up to 6%), operational efficiency (cost reduction up to 0.85%), and people/culture (attrition down up to 20% and onboarding faster up to 25%) - plus hard-to-quantify gains like compliance and security. A five-step method and example calculation (~205% three-year ROI) show how to model low/mid/high scenarios and decide whether to adopt based on workflow fit, readiness, and budget.
 Tips & Tricks
How to Separate by First & Last Name in Excel
Mаnу businesses need first and last names in separate Excel columns for easier sorting, searching, and personalised communications. Excel’s Text to Columns feature lets you split names fast by selecting a space delimiter, while LEFT/RIGHT formulas achieve the same result with flexible cell references. Dragging these formulas down fills the entire list automatically, saving hours over manual copying.
 Tips & Tricks
How to Create a Stacked Bar Chart in Excel
A stacked bar chart lets you see both totals and the category-level breakdown within each bar, making comparisons richer than a standard bar chart. The article walks you through creating one in Excel: organise data by categories, select the range, choose Insert › Stacked Column, and fine-tune titles, legends, colours, and data labels. Best practices include limiting each bar to roughly four stacks, adding concise labels, and using clearly distinguishable colours to keep the visualisation readable. W